iPlayer Usage Effect - A Bandwidth Explosion
- Subscribe to RSS Feed
- Mark as New
- Mark as Read
- Bookmark
- Subscribe
- Printer Friendly Page
- Report to Moderator
- Plusnet Community
- :
- Plusnet Blogs
- :
- iPlayer Usage Effect - A Bandwidth Explosion
iPlayer Usage Effect - A Bandwidth Explosion
 There's been a lot of talk in the media about the BBC's iPlayer in the past few weeks with stories on The Register such as this and this, The Guardian here and here, ThinkBroadband, Screendigest, ZDNet, and hundreds more on other places too, some of which are linked here. There's also been lots of talk about the availability of iPlayer, there's news about plans for the Mac version and a US version too is apparently on the way. We, though, can give a different perspective, a bit of insight on things and maybe explode a few myths. Here's just a few headlines:
- 5% growth in total average usage since 1st December
- 66% growth in volume of streaming traffic since 1st December
- 2% growth in the number of customers using their connection for streaming since 1st December
- 72% growth in the number of customers using over 250MB of streaming in a month since December
- 100% growth in the number of customers using over 1GB of streaming in a month since December
- Cost of carrying streaming traffic increased from £17,233 to £51,700 per month
So how did we get to these headlines? Well, through our traffic management systems we get a lot of visibility of how our customers are using their connections. We classify iPlayer as streaming so when customers look at the View My Broadband Usage tool they can see the split of traffic types and see how much streaming they've used. From our reports we can see that in detail across all our customers and spot patterns and trends as well as providing invaluable data about how the network performs and how customers use the Internet. A few stats first, 23,441 of our customers used over 250MB of streaming (download only) in January, with a mean of 947MB between them. That's up from 13,569 customers that did more than 250MB in December (with a mean of 856MB) and going back a year 12,225 did over 250MB with a mean of 781MB in January 2007. 6,083 customers streamed more than 1GB of data in January 2008 (2.2GB mean) against 3,045 in December (2.1GB mean) and 2,253 in January 2007 (2.1GB mean). We'll cover off some more stats below but the summary is that more people are streaming and streaming more. Previous posts we've made have focussed on changing usage habits and new applications such as the aforementioned iPlayer. This post is kind of about putting those together and looking at the effect that new applications are having on usage and where this is leading us. We've been doing a lot of analysis of customer usage of late, trying to understand in ever more detail about how our customers are using their connections and also when they are using their connections. One thing we've noticed is that the mean usage is on the way up and in particular the type of usage is streaming and it's being used more in an evening. I'll illustrate this firstly with a little data. Each month we produce a breakdown of usage and supply it to the PlusNet usergroup. Just using one of the figures, the mean usage per customer over the past few months is as follows: June 2007 6.40GB July 2007 6.54GB August 2007 6.46GB September 2007 6.35GB October 2007 6.61GB November 2007 6.55GB December 2007 6.42GB January 2008 6.74GB It's not unexpected to see a small decrease in June, September, November as those months only have 30 days and also in December because of Christmas but the January increase is certainly a noticeable increase whichever month you compare it to. Note that the BBC launched the iPlayer on Christmas day and have been heavily promoting on TV ever since. When you break that usage down though into different protocols, it's streaming that's seeing the big increase. The following graph shows mean streaming usage (download only) across the past 3 months (1st November to 31st January) in MB per hour per customer for 5 hours of the day (each line represents a particular hour). 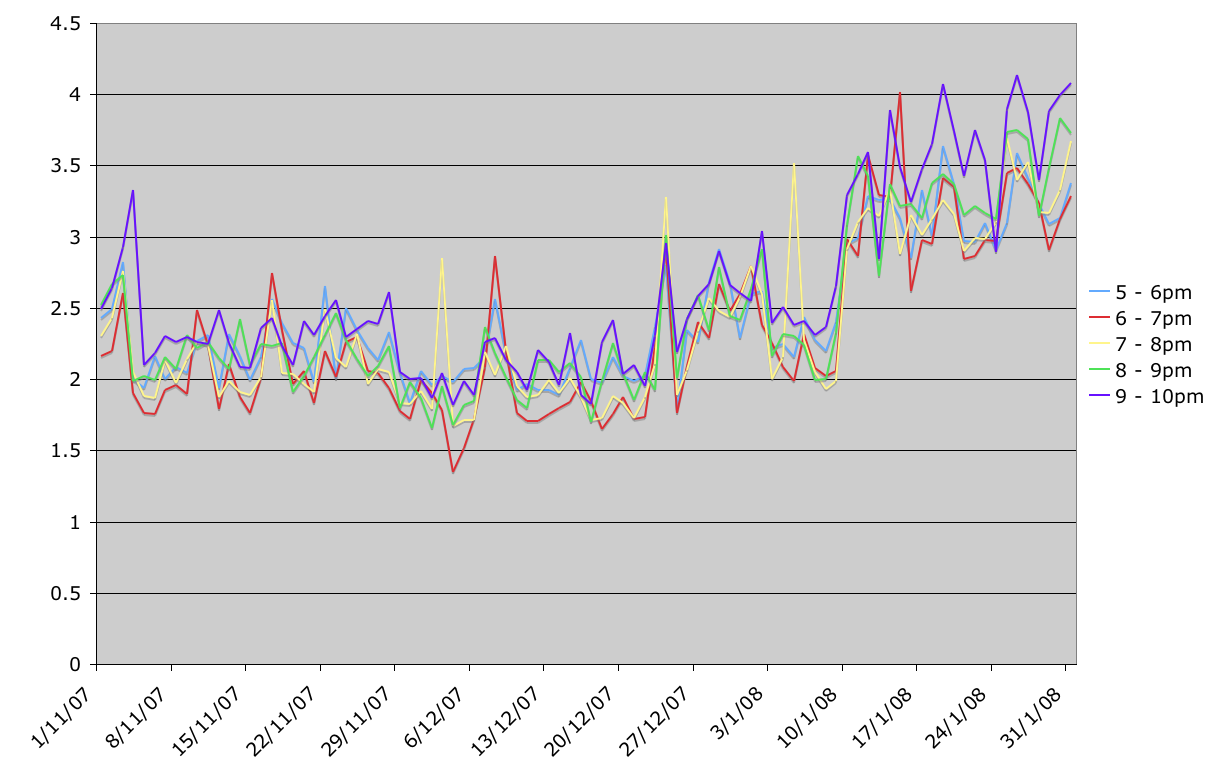 (Click any of the images for a larger version.) As you can see in early November on average customers that were using streaming used around 2 - 2.5MB per hour but by the end of January that had increased to 3 - 4MB per hour. There's also a graph of the number of customers that used streaming in each particular hour.
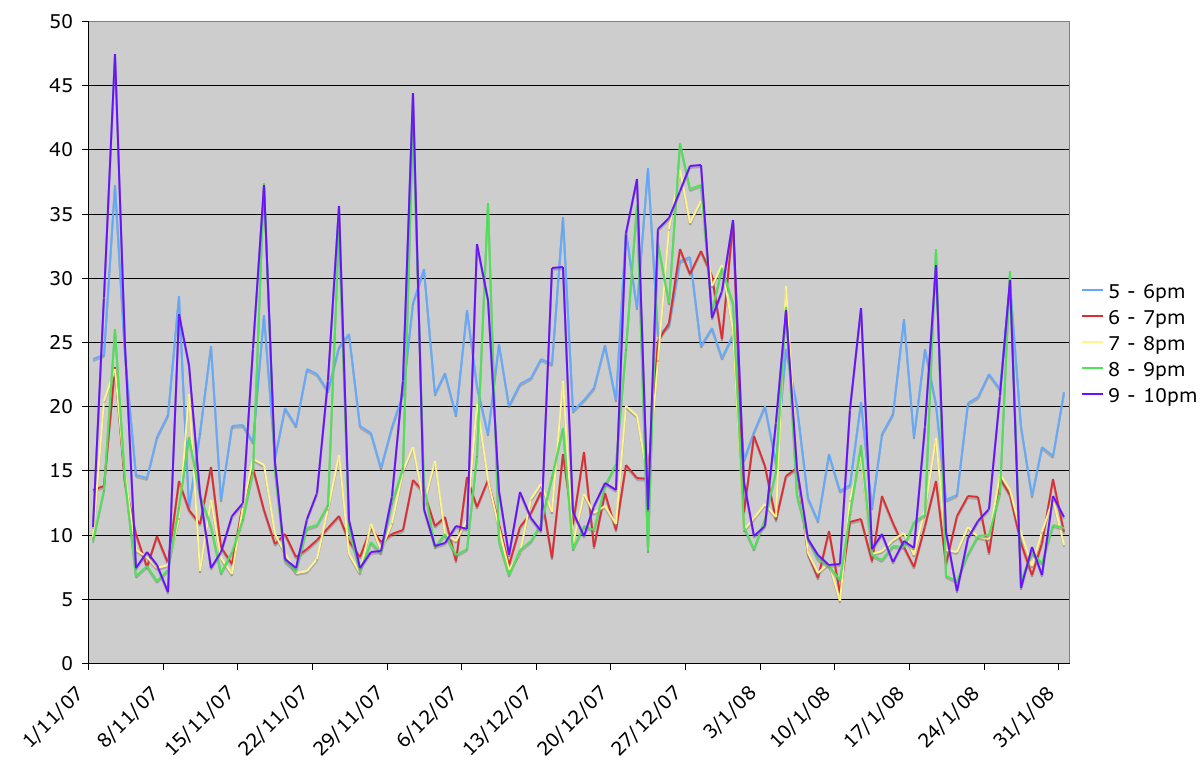
 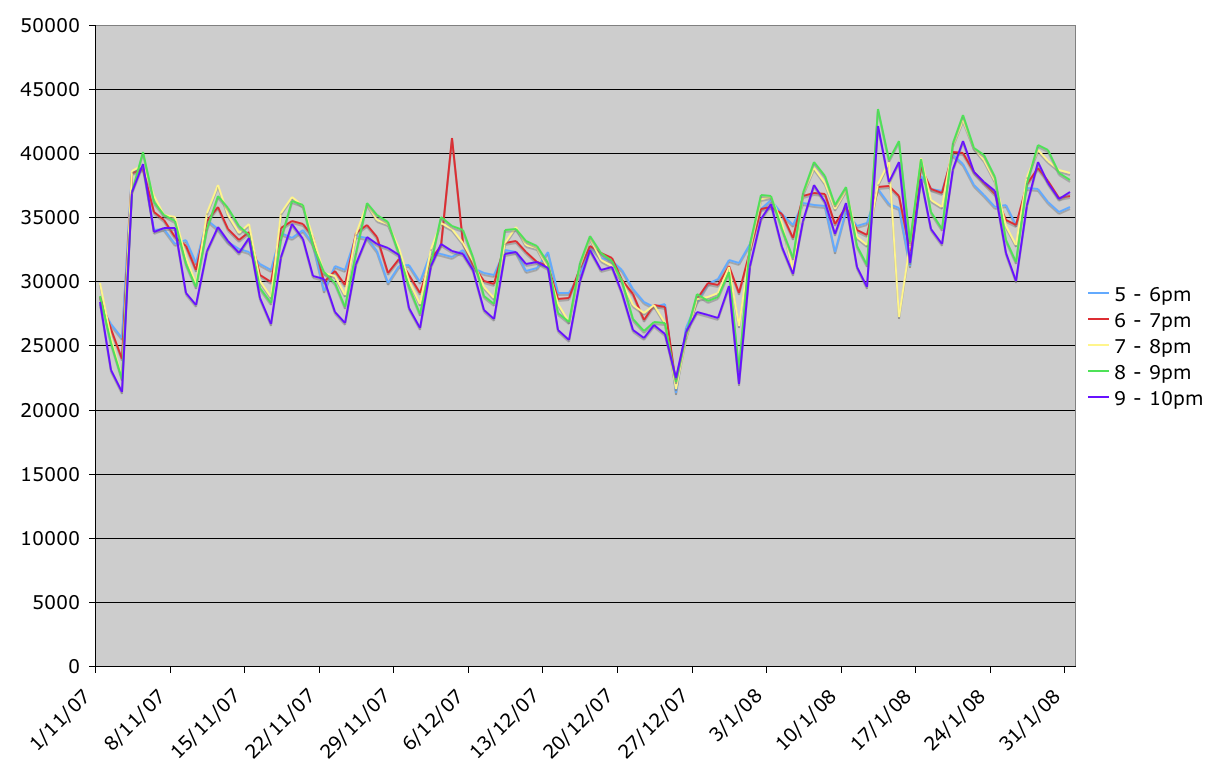 We can also compare this to web browsing/instant messenger traffic with again both the MB per hour per customer
 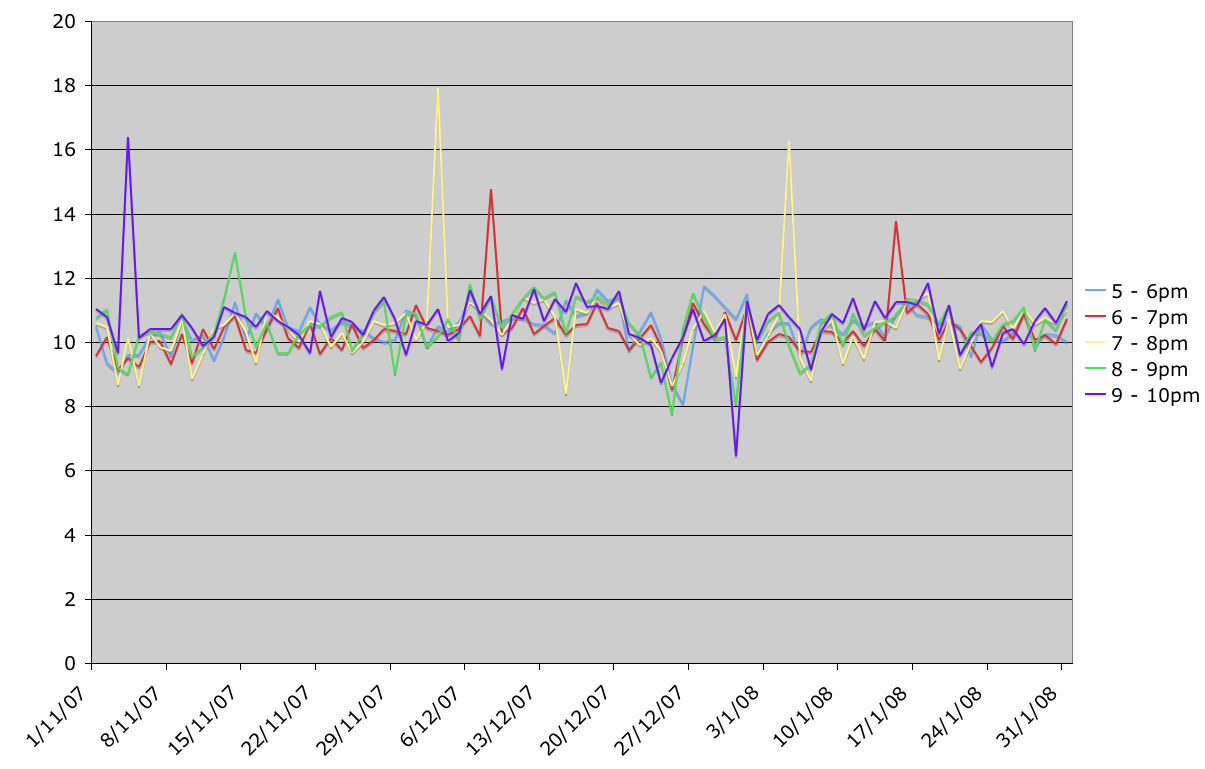 and number of customers using that type of traffic per hour.
 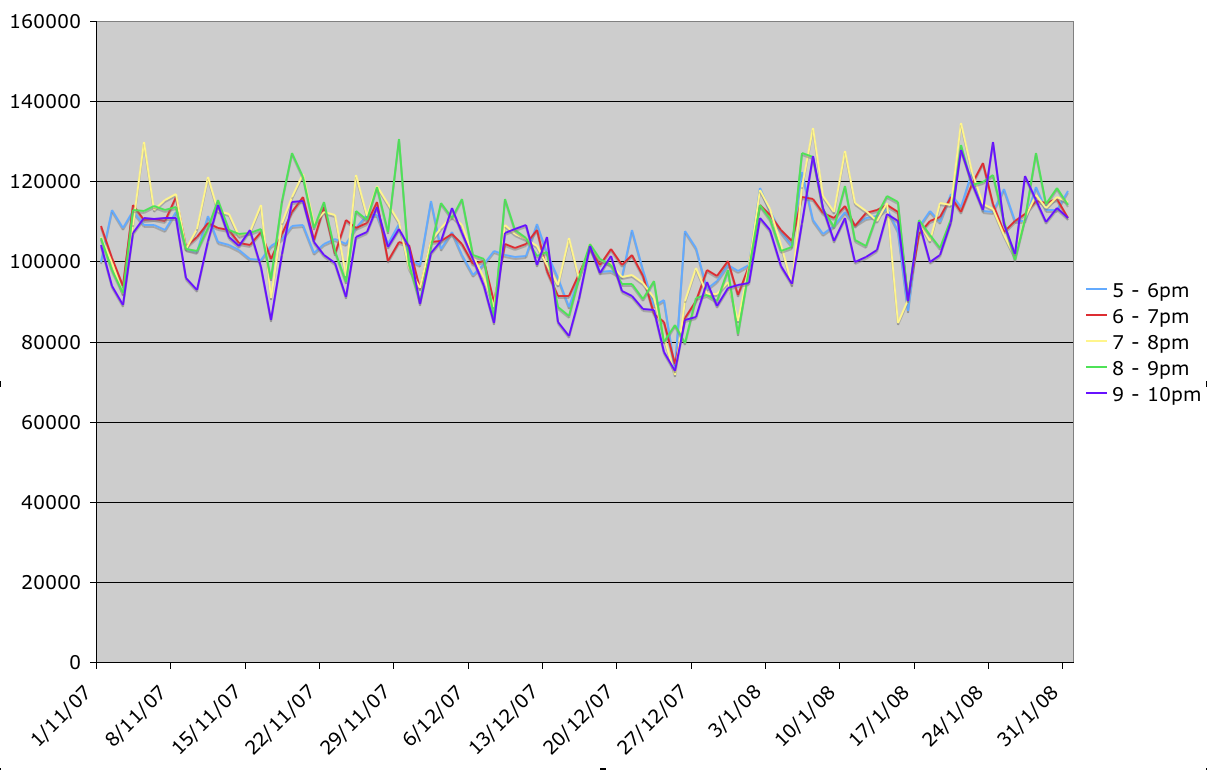 The web traffic over the same time period is roughly static in terms of MB per hour per customer and the number of customers using that type of traffic increasing a little in line with customer growth (apart from a dip at Christmas). (Note, this data is taken from the Ellacoya traffic management systems and will include any customer that used any amount of streaming in each hour whether that was 1 byte or 1GB or any other amount). For another bit of comparison here are the usage graphs for P2P and Usenet
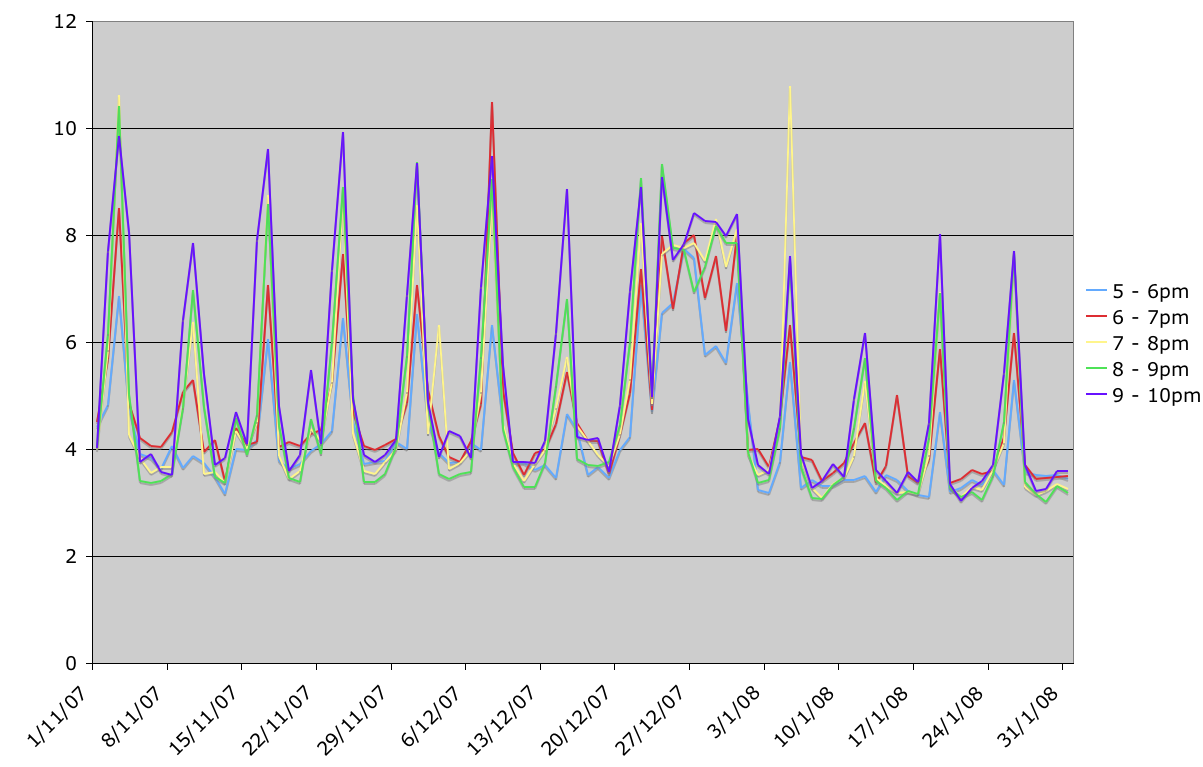
 and gaming. The P2P and Usenet graphs "spike" because when the network is quieter such as Friday and Saturday nights or over Christmas when there's more bandwidth available for these types of application. Also again the graphs include anyone that did at least 1 byte of P2P or Usenet during each hour and Usenet will include text as well as binary usage.
 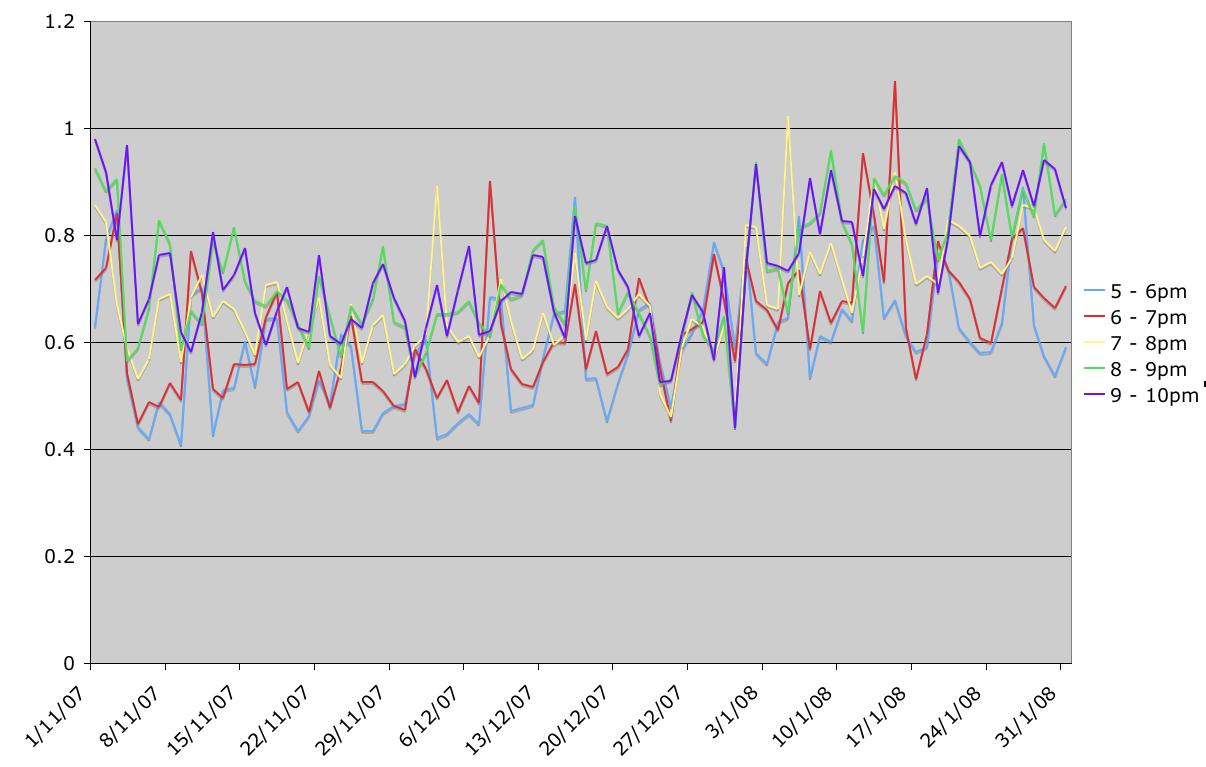 We also have a split of the streaming usage into each of the different products. This graph is showing streaming over the last 2 months for one particular hour (6 - 7pm).
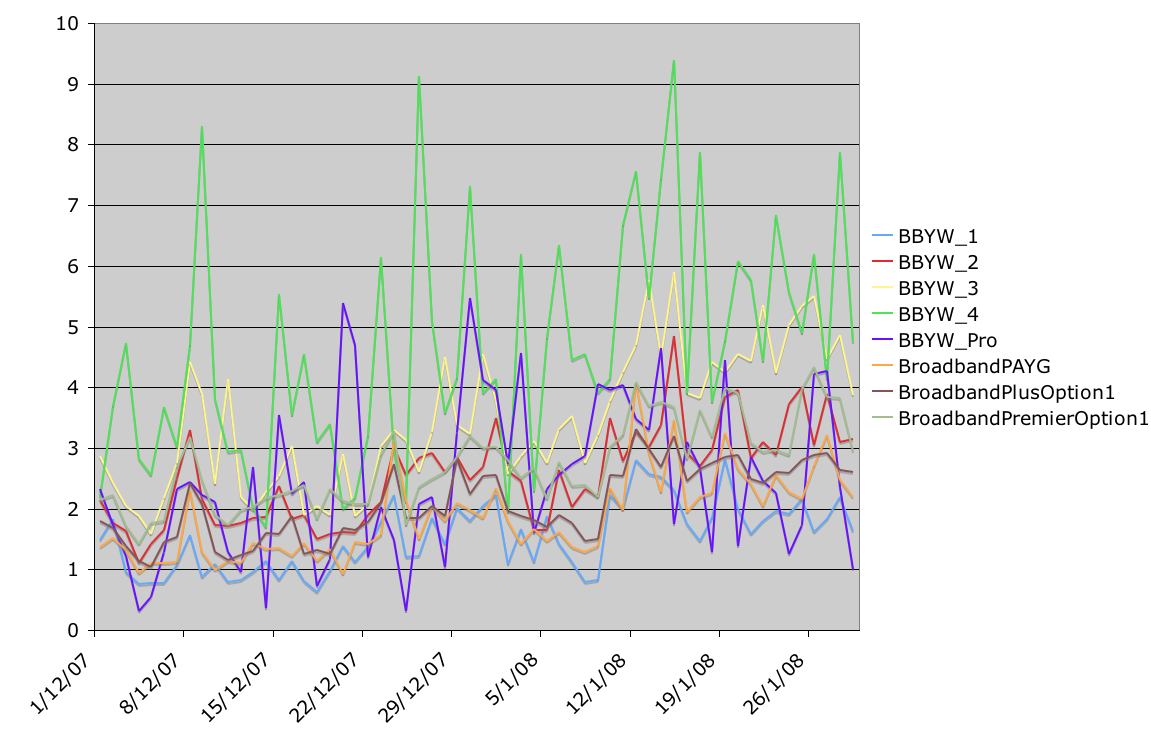
As you'd probably expect, BBYW 3 and 4 have the highest usage but there's a general increase across each account type.While this graph shows the same time period but the number of customers on each product type using streaming.
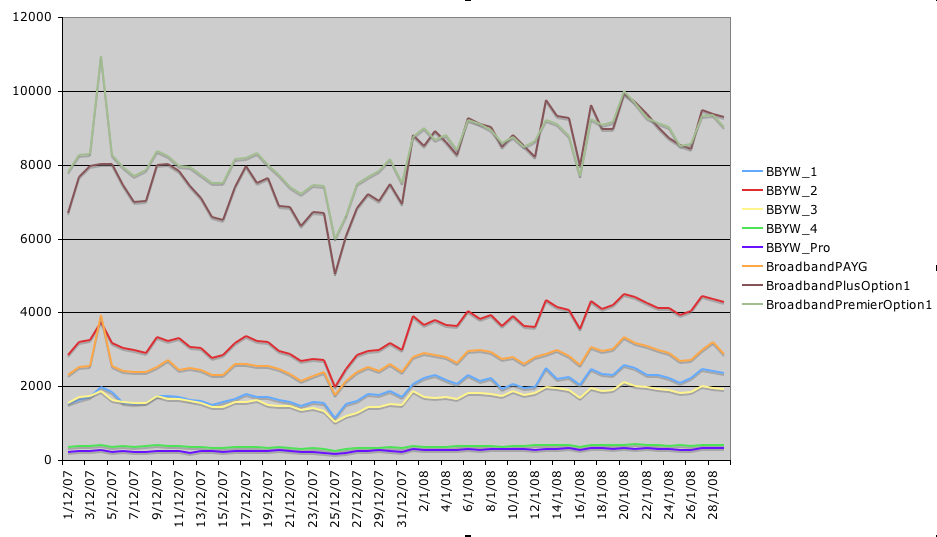
What's quite telling is that not only is there an increase over the last 2 months of customers using streaming but that there's an increase on Broadband Plus and Premier as well as BBYW which are both accounts we no longer sell and as such the total number of customers on these products is declining.
Here's another breakdown of the usage. Just looking at residential accounts, in November 174,779 customers had usage in streaming, using a total of 33,189GB which works out as a mean of 190MB per customer for the month. In December 177,093 customers had usage in streaming, using a total of 31,859GB or a mean of 180MB per customer for the month. This was likely reduced from November because of Christmas. However, in January 181,108 customers had usage in streaming, with a total of 52,970GB or a mean of 292MB per customer for the month. That's a total increase of 66% in January against December, 60% against November. Per customer the increase is 62% up in January against December and 54% up against November. (A combination of natural customer growth and more existing customers using streaming that hadn't previously would account for the higher increase in the total above the per customer figure). Ian's spoken earlier about future developments in set top boxes and particularly of relevance here are the boxes (and TVs themselves) that can combine streaming over the Internet along with Freeview, etc. At the moment the majority of this growth in traffic will be down to iPlayer (with some 4OD, Sky Anytime and Joost thrown in) and likely most people will be watching it on their PCs. We can only imagine what the growth will be like when that majority shifts from the PC to the TV. The growth though of this type of traffic does add a couple of factors to our product design, we design each of our products around a certain amount of usage and make assumptions about how that usage is used. For example, Broadband Your Way Option 2 has a usage allowance of 8GB which is counted over the hours of 8am to midnight. It may be though that a large percentage of the customers on BBYW Option 2 use more of their 8GB than before (or go over the 8GB and buy additional usage) and use that extra usage in the evening. This ties perfectly in with the myth of unlimited broadband. On BBYW, as customers use more, the revenue we receive will increase. The amount of additional usage (along with customer numbers and mix of product) is one of the factors we use in determining the amount of capacity we require so we factor in the extra revenue gained from customers using more due to something like iPlayer and provision the capacity necessary. We aren't saying that the growth of streaming isn't a scary proposition, and where there's one thing there's bound to be another thing on the horizon (set top boxes, Project Kangaroo from BBC, ITV and Channel 4, iTunes movie rentals and HD movies to name just a few of things that are on the way) but it's got to be even more scary for some. Dave Tomlinson PlusNet Product Team