Turn on suggestions
Auto-suggest helps you quickly narrow down your search results by suggesting possible matches as you type.
Showing results for
About Wireshark and how to use it
About Wireshark and how to use it
Topic Options
- Subscribe to RSS Feed
- Mark as New
- Mark as Read
- Bookmark
- Subscribe
- Printer Friendly Page
- Report to Moderator
- Plusnet Community
- :
- Library
- :
- About Wireshark and how to use it
About Wireshark and how to use it
08-05-2009
11:59 PM
- What Is Wireshark?
- When To Use Wireshark
- How to Capture Data
- Analysing The Data
- Traffic Queues
- The Traffic Prioritisation Is Wrong
1. What Is Wireshark?
Wireshark is a free network protocol analyser - it captures information about all network activity from your computer and can be used in diagnosing problems you may have with network performance, be it general or for a specific application.Wireshark can be downloaded from here. Choose the file appropriate to your computer's operating system. Note that a Windows portable version is also available which can be installed on a USB key.
Wireshark was written by an international group of networking experts, and is open source software. Plusnet cannot be held liable for issues that arise from the download or use of the software.
[Top]
2. When To Use Wireshark
If you think that a particular application is transferring data slowly or performance is not what should be expected, Wireshark can help determine that your data is being prioritised correctly.[Top]
3. How to Capture Data
See a video tutorial on data capture - [Windows] [Mac OS X].- Firstly, start Wireshark by double clicking the application icon on your desktop:

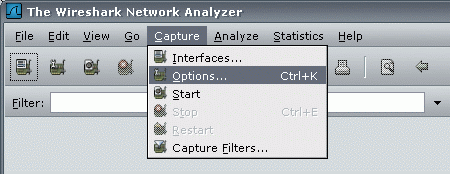
- Select Options from the Capture menu:
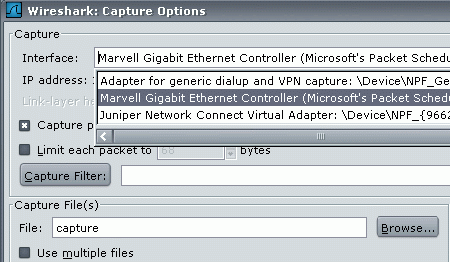
- Select the relevant network interface from the drop-down at the top of the Options window. If you are using a router this will be your Network (NIC) card. If you are using a USB modem the interface is still likely to be listed as a network adapter. However you should be able to find this from its description.
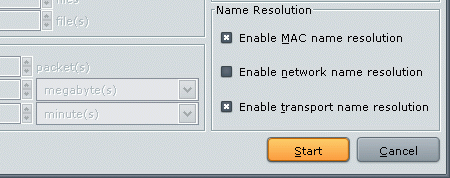
- At this stage you should also enter a descriptive name in the File: field. By default this is pointed at your desktop:
- At this point, it is best to shutdown any other applications that might be causing network traffic like IM clients, email clients and Peer-to-Peer applications. Failure to do this can make it difficult to interpret the captures.
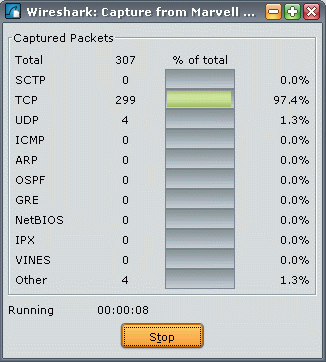
- Click Start to start capturing traffic:
- Once the packet capture has begun you can open the application or download for which you want to check the priority of.
Important: you should only do this after the packet capture has started.:
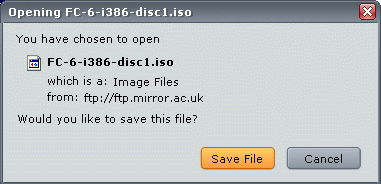
- Here we're downloading a HTTP file from mirror.ac.uk:
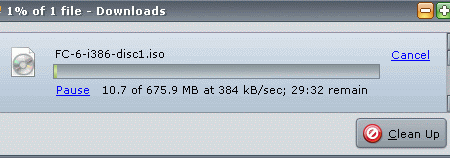
- Packet captures can result in fairly large files if left running for long. You only need to capture about 10 seconds of traffic. After this time click Stop:
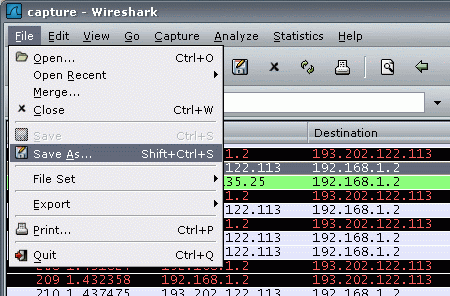
- Now the data is captured you will need to store the results in a file. Select Save As from the file menu:
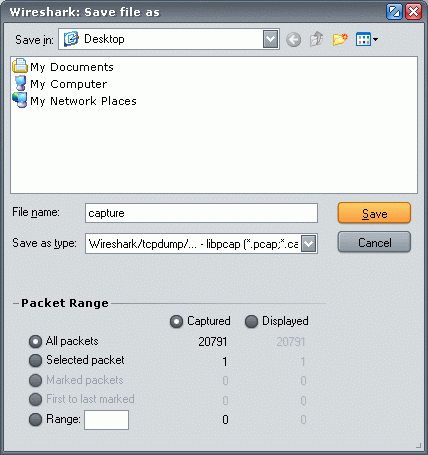
- Save the file with a relevant filename ready to send to us. Please ensure you save the file as a Wireshark .pcap file and then compress it into a .zip file.
[Top]
4. Analysing The Data
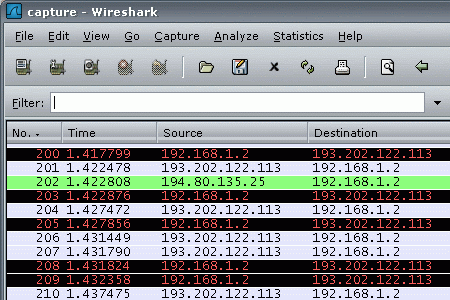
The following information shows you how to interpret the data that has been captured by Wireshark.- The screenshot below is a packet capture taken just before and during a http download of a Linux ISO from mirror.ac.uk.
- We need to locate a packet that has been sent from the download source to your computer. It is important that we capture traffic that is traveling in this direction (to the customer) as upstream traffic will not have been marked by the Ellacoyas.
- Look at the line highlighted in green that shows a packet that has been sent from the IP address 194.80.135.25 to the IP address 192.168.1.2.
- 192.168.1.2 is a local IP address; 194.80.135.25 is the IP address for mirror.ac.uk as we can see from nslookup:
C:\Documents and Settings\user>nslookup 194.80.135.25
Server:  pth-cdns01.plus.net
Address:  212.159.13.49
Name:    mirror.ac.uk
Address:  194.80.135.25
Aliases:  25.135.80.194.in-addr.arpa
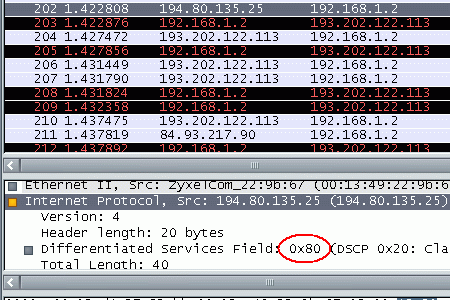
- Now we've found the right packet we need to highlight it and expand the Internet Protocol option in the middle pane.
- Here you'll see a line headed Differentiated Services Field. Next to this is a hexadecimal value. This value shows us how the data has been prioritised over the network.
- Here we see the value 0x80 which is Gold traffic and therefore the correct queue for interactive traffic.
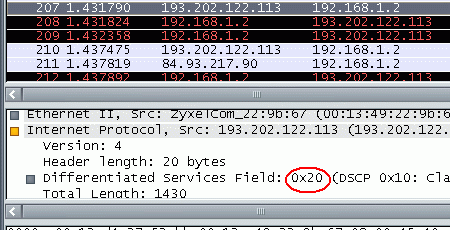
- The following example shows an incoming packet that has been marked with the value 0x40. Let's take a look at what this traffic could be by running an nslookup again on the originating IP address:
C:\Documents and Settings\user>nslookup 193.202.122.113
Server:  pth-cdns01.plus.net
Address:  212.159.13.49
Name:    unknown.ams.astraweb.com
Address:  193.202.122.113
- The originating server belongs to Astraweb who provide Binary Usenet access. 0x20 denotes traffic that has been marked for the Bronze traffic queue. Again this is correct for the type of traffic that has been captured.
[Top]
5. Traffic Queues
The following table shows the various queues and their corresponding hex values in descending priority order.| Traffic Queue | Hex Value | Example |
|---|---|---|
| Titanium | 0x48 or 0xA0 | Gaming & VoIP |
| Gold | 0x00 or 0x80 | Interactive traffic |
| Silver | 0x40 or 0x0c | Unclassified traffic |
6. The Traffic Prioritisation Is Wrong
If you find that your traffic has been incorrectly prioritised you can supply us with the captured data so we can get this looked into.Please contact our support team who will advise you of how to provide this capture to us.
[Top]