Usage Marches On - What iPlayer did in February
- Subscribe to RSS Feed
- Mark as New
- Mark as Read
- Bookmark
- Subscribe
- Printer Friendly Page
- Report to Moderator
- Plusnet Community
- :
- Plusnet Blogs
- :
- Usage Marches On - What iPlayer did in February
Usage Marches On - What iPlayer did in February
 It's been a couple of weeks since we posted the last blog about usage and in particular what's becoming the "iPlayer effect" so figured an update was probably due now that we have February's usage data processed. We'll stick with a similar format and start with a few headlines. I don't think this post really needs to be as long as the previous ones, more trying to keep the data up to date and looking the trends.
- Usage in the evening per customer up approximately 16% over the last year
- 18.3% of customers used more than 250MB of streaming last month
- 6.4% of customers used more than 1GB of streaming last month
- 3% of customers used more than 2GB in of streaming last month
- Mean usage for February was 6.49GB, adjusting for the shorter month that's an increase of 2.9% over January
- 27% growth in streaming overall since January, 25% increase per customer
We'll come back to these headlines in a moment but first I'd like to clear up a few misunderstandings that seem to have cropped up from previous posts. The main aim of these blogs isn't to have a moan about people using their connections, complain about the usage patterns we are seeing or in any way suggest that the web will clog up and there is some sort of meltdown imminent. The idea is to highlight how usage patterns are changing, and in particular in relation to iPlayer how the right application, and in this case from a trusted source, can have a big impact on how the nation uses the Internet. The blogs are also useful in allowing people to understand how our forecasting works and what we do to ensure we have the right amount of capacity. We're actually welcoming the use of iPlayer because it firstly underscores our product design; on our Broadband Your Way products as usage increases we'll need to add extra capacity for people to get the performance they are paying for, and that extra capacity is paid for through people buying extra GBs, or upgrading to an account with a higher allowance. It's a cyclical nature and so long as we're predicting each stage of the cycle correctly we can deliver a quality service that's sustainable. Secondly of course, most of us here use iPlayer and think it's great, which is probably along the same lines that most of the customers that have tried it think. Yes, it provides us with a challenge in managing the network and getting the capacity forecasting right as I say, but it also provides a real opportunity to get even better at that forecasting. We've seen other applications going from zero traffic to taking up 2% or more of the total network capacity, but generally over a much larger period of time. The iPlayer growth has allowed us to see what happens when a mass market application starts to take off in a big way. It's also given us the opportunity to plug in previous applications and "extreme events" into the forecast model to be able to more accurately judge the take-up and usage requirements of the next iPlayer or YouTube HD. We can also see the early stages of adoption and see how that traffic grows and changes so we can use that in modelling future applications. OK, that's enough of an aside, let's go back and expand on each of the headlines to see the context and the change from previous months. Usage in the evening (measured between 4pm and midnight) per customer has grown by approximately 16% in the last 12 months with most of that growth since December (growth from March to December was about 6%). 18.3% of customers used more than 250MB of streaming in February, which is the equivalent of roughly one half hour show streamed via iPlayer. That's up from about 11% last month and 6.4% in December (measuring downloaded bytes only between 8am and midnight). 6.4% of customers used more than 1GB of streaming in February, previously this was 5.3%of customers in January, 3.2% in December and 3.5% in November (download only between 8am and midnight). 3% of customers used more than 2GB of streaming in February, the number was previously 2.5% in January, 1.4% in December and 1.7% in November (again download only between 8am and midnight). Mean usage per month in February was 6.49GB, down a bit on January's 6.74GB but of course February only had 29 days. Adjusting for that by working out the usage per day and usage actually increased by 2.9% in February. Looking at total usage (upload and download across the whole month) 95.8% of residential customers had usage in streaming in February (up 2% from January) using a total of 63,043GB (up from 52,970GB in January) despite the shorter month. In absolute numbers that's an increase of 19%, but adjusting for the shorter month that works out as a 27% increase (it was a 66% increase between December and January). Per customer February's streaming usage was 341MB, in January it was 292MB per month. So in absolute numbers the increase per customer is 17% but again adjusting for the shorter month an increase of about 25% per customer (December to January was 62%). So not surprisingly we're still seeing an increase in streaming, but it has slowed down a little. Streaming traffic is inching ever closer to taking up 10% of our customers' usage across the month; in some hours of the day for some of our products it is already there. This is probably the busiest hour of the day for streaming - 9 to 10pm where it's now creeping towards 11% of all traffic in that hour. 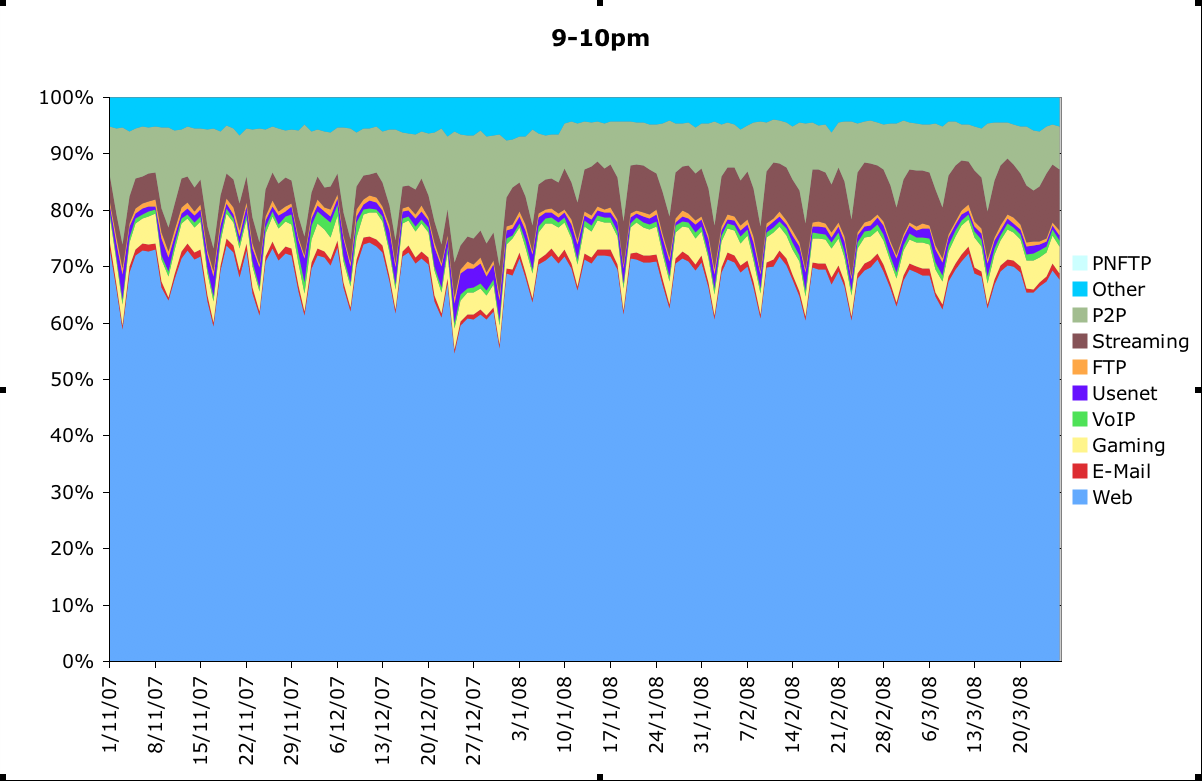 We're expecting streaming usage to continue to grow but it's difficult to predict by how much right now. We've modelled various different scenarios to see how that effects the network. We could for example see usage increase at a steady rate over the next 12 months similar to last year, we could see a bigger increase like we've seen so far this year, the increase could level off over the next few months then pick up again as something (like iPlayer) becomes the big mass market proposition (think in the same way as the growth in the take up broadband itself, or an S shape) or we could just see an exponential growth where usage increase at an increasing rate month on month. Each different scenario illustrates why it's very important to have the right product design, the bigger the usage increase the more capacity is required, and in the world where capacity equals big money if you're seeing the kind of growth you could see in usage then having fixed revenue is going to be a killer. Which is why we are getting into far more detail in the way we forecast the capacity, not only are we looking at average usage but what drives the usage and when that usage is being used and by which customers on which product. Knowing the growths and the trends and what events are on the horizon is the best way we can see to forecast the future. One interesting bit that's come out of that analysis is a possible side effect of the increase in streaming usage. We've noticed that gaming usage has dropped a little. There's a small increase (about 1.4%) of the number of customers using gaming (we'd expect it to go up through natural growth in customer numbers) but about a 1% decrease in the amount of gaming traffic (adjusting for the shorter month). It may be that people are still gaming but rather than 2 hours of gaming they are doing an hour of gaming and an hour of streaming. I wonder if the price drop on the Xbox 360 or the upcoming big franchise games (Mario Kart Wii, Grand Theft Auto IV, Grand Turismo 5 Prologue) will make any difference. Dave Tomlinson PlusNet Product Team
- Tags:
- technology
- TV