'Normal' evening SNRM drop/flat twisted pair RJ11 cable.
- Subscribe to RSS Feed
- Mark Topic as New
- Mark Topic as Read
- Float this Topic for Current User
- Bookmark
- Subscribe
- Printer Friendly Page
- Plusnet Community
- :
- Forum
- :
- Help with my Plusnet services
- :
- Broadband
- :
- 'Normal' evening SNRM drop/flat twisted pair RJ11 ...
Re: 'Normal' evening SNRM drop/flat twisted pair RJ11 cable.
26-11-2014 4:14 PM
- Mark as New
- Bookmark
- Subscribe
- Subscribe to RSS Feed
- Highlight
- Report to Moderator
Uptime: 0 days, 7:54:57 (+ 2 HRS)
DSL Type: ITU-T G.992.5
Bandwidth (Up/Down) [kbps/kbps]: 1,217 / 8,242
Data Transferred (Sent/Received) [MB/MB]: 39.79 / 668.00
Output Power (Up/Down) [dBm]: 12.8 / 0.0
Line Attenuation (Up/Down) [dB]: 16.8 / 37.0
SN Margin (Up/Down) [dB]: 5.9 / 12.4 ( -0.8)
System Vendor ID (Local/Remote): TMMB / ----
Chipset Vendor ID (Local/Remote): BDCM / IFTN
Loss of Framing (Local/Remote): 44 / 0 (unchanged)
Loss of Signal (Local/Remote): 5 / 0 (unchanged)
Loss of Power (Local/Remote): 0 / 0
Loss of Link (Remote): -
Error Seconds (Local/Remote): 210 / 0 (+ 1)
FEC Errors (Up/Down): 482 / 7,448 (+7/+616)
CRC Errors (Up/Down): 87 / 55 (unchanged/+1)
HEC Errors (Up/Down): 127 / 254 (unchanged/unchanged)
Re: 'Normal' evening SNRM drop/flat twisted pair RJ11 cable.
26-11-2014 9:21 PM
- Mark as New
- Bookmark
- Subscribe
- Subscribe to RSS Feed
- Highlight
- Report to Moderator
Will raise a fault 24 hours after that if there is no improvement, but meanwhile thanks to Anotherone in particular for his endeavours.

Re: 'Normal' evening SNRM drop/flat twisted pair RJ11 cable.
27-11-2014 12:32 AM
- Mark as New
- Bookmark
- Subscribe
- Subscribe to RSS Feed
- Highlight
- Report to Moderator
Though strange that the line should have dropped this evening - how long was it down for? If circa 3 minutes it could have been a line test.
Seems like you are being pushed into a night time resynch. If left alone, you will see an increase in SNRM in the morning.
In another browser tab, login into the Plusnet user portal BEFORE clicking the fault & ticket links
Superusers are not staff, but they do have a direct line of communication into the business in order to raise issues, concerns and feedback from the community.
If this post helped, please click the Thumbs Up and if it fixed your issue, please click the This fixed my problem green button below.
Re: 'Normal' evening SNRM drop/flat twisted pair RJ11 cable.
27-11-2014 5:14 AM
- Mark as New
- Bookmark
- Subscribe
- Subscribe to RSS Feed
- Highlight
- Report to Moderator
There is clearly something intermittent happening. It's totally unlikely to be a line test as there is no fault ticket at present (nor do I think without some further evidence of something to investigate that it would achieve anything at this point) and there would be a post on here if one had been requested via the forum. As for "pushed into a night-time resync" there is not, at present, the slightest bit of evidence to suggest any reason why this should happen.
JayG whilst I can sympathise with your line of thought about your old setup, it won't yield some of the diagnostic information that the 582n gives, never mind the lack of wireless, so whilst this might be an avenue worth exploring in due course it would be a better idea to persist a little longer and post the information that's available.
Could we see the SNRM graphs to date, the DSL stats, and the Telnet log - easiest as has been mentioned via RouterStats - 3rd icon from the right - use the drop down choice to select the Telnet log - select all copy and paste to a file saved somewhere convenient, also pasted into a post.
On the subject of the "setup" itself, how long have you had this TG582n?
Re: 'Normal' evening SNRM drop/flat twisted pair RJ11 cable.
27-11-2014 8:44 AM
- Mark as New
- Bookmark
- Subscribe
- Subscribe to RSS Feed
- Highlight
- Report to Moderator
The TG582n was (or should have been) brand new about a month ago, the introduction of the twisted pair extension cable came after a few weeks (recorded earlier in this thread) and the problems started with it appearing to have difficulties living with a 3dB margin (so did the Netgear which it replaced, but I could tweak that to 5dB, and it ran perfectly for a few years like that.)
I am well aware that just because things have been fine for a long time it doesn't mean that something hasn't at last gone wrong - it just seems a bit too much of a coincidence given these particular circumstances.
Anyway, most recent router event log follows, will put together some of the captures in another post covering the period of yesterday evening's drop, plus a few other overnight ones which judging from the router DSL stats should show something happening on the error front, although the connection has not dropped again.
<173> Nov 26 08:08:34 xDSL linestate up (ITU-T G.992.5; downstream: 8242 kbit/s, upstream: 1217 kbit/s; output Power Down: 20.4 dBm, Up: 12.8 dBm; line Attenuation Down: 37.0 dB, Up: 16.8 dB; snr Margin Down: 12.1 dB, Up: 6.3 dB)
<38> Nov 26 08:08:37 PPP CHAP Receive challenge from rhost bras-red9.sf (Internet)
<38> Nov 26 08:08:38 PPP CHAP Receive challenge from rhost PTW-AG01 (Internet)
<38> Nov 26 08:08:38 PPP CHAP Receive success (Internet)
<85> Nov 26 08:08:38 FIREWALL event (1 of 2): deleted rules
<132> Nov 26 08:08:38 PPP link up (Internet) [146.90.58.49]
<85> Nov 26 08:08:38 FIREWALL event (1 of 1): created rules
<85> Nov 26 08:08:38 FIREWALL event (1 of 1): modified rules
<14> Nov 26 08:09:23 CONFIGURATION saved by TR69
<37> Nov 26 08:12:55 LOGOUT User admin logged out on TELNET (192.168.1.64)
<37> Nov 26 08:13:16 LOGIN User admin logged in on TELNET (192.168.1.64)
<81> Nov 26 08:23:12 FIREWALL icmp check (1 of 1): Protocol: ICMP Src ip: 123.205.159.146 Dst ip: 146.90.58.49 Type: Destination Unreachable Code: Port Unreacheable
<37> Nov 26 08:32:11 LOGIN User admin logged in on [HTTP] (from 192.168.1.64)
<37> Nov 26 09:00:36 LOGIN User admin logged in on [HTTP] (from 192.168.1.64)
<102> Nov 26 09:02:22 SNTP Synchronised to server: 212.159.6.10
<37> Nov 26 09:51:43 LOGIN User admin logged in on [HTTP] (from 192.168.1.64)
<37> Nov 26 09:54:12 LOGIN User admin logged in on [HTTP] (from 192.168.1.64)
<102> Nov 26 10:02:22 SNTP Synchronised to server: 212.159.6.9
<37> Nov 26 10:51:43 LOGIN User admin tried to log in on TELNET (192.168.1.64)
<37> Nov 26 10:52:23 LOGIN User admin logged in on TELNET (192.168.1.64)
<37> Nov 26 11:01:57 LOGOUT User admin logged out on TELNET (192.168.1.64)
<102> Nov 26 11:02:22 SNTP Synchronised to server: 212.159.6.10
<37> Nov 26 11:15:35 LOGIN User admin logged in on [HTTP] (from 192.168.1.64)
<37> Nov 26 11:56:05 LOGIN User admin logged in on TELNET (192.168.1.64)
<37> Nov 26 11:57:30 LOGOUT User admin logged out on TELNET (192.168.1.64)
<102> Nov 26 12:02:22 SNTP Synchronised again to server: 212.159.6.10
<37> Nov 26 12:04:04 LOGIN User admin logged in on [HTTP] (from 192.168.1.64)
<102> Nov 26 13:02:22 SNTP Synchronised to server: 212.159.6.9
<37> Nov 26 13:04:23 LOGIN User admin logged in on [HTTP] (from 192.168.1.64)
<37> Nov 26 13:15:47 LOGIN User admin logged in on [HTTP] (from 192.168.1.64)
<37> Nov 26 13:27:30 LOGIN User admin logged in on [HTTP] (from 192.168.1.64)
<37> Nov 26 13:31:26 LOGIN User admin logged in on [HTTP] (from 192.168.1.64)
<37> Nov 26 13:53:29 LOGIN User admin logged in on [HTTP] (from 192.168.1.64)
<102> Nov 26 14:02:22 SNTP Synchronised to server: 212.159.6.10
<37> Nov 26 14:11:40 LOGIN User admin logged in on [HTTP] (from 192.168.1.64)
<37> Nov 26 14:46:39 LOGIN User admin logged in on [HTTP] (from 192.168.1.64)
<37> Nov 26 14:57:15 LOGIN User admin logged in on [HTTP] (from 192.168.1.64)
<102> Nov 26 15:02:22 SNTP Synchronised to server: 212.159.13.49
<37> Nov 26 15:24:18 LOGIN User admin logged in on [HTTP] (from 192.168.1.64)
<37> Nov 26 15:55:11 LOGIN User admin logged in on [HTTP] (from 192.168.1.64)
<102> Nov 26 16:02:22 SNTP Synchronised to server: 212.159.6.9
<37> Nov 26 16:02:54 LOGIN User admin logged in on [HTTP] (from 192.168.1.64)
<102> Nov 26 17:02:22 SNTP Synchronised to server: 212.159.6.10
<37> Nov 26 17:08:22 LOGIN User admin logged in on [HTTP] (from 192.168.1.64)
<81> Nov 26 17:16:24 FIREWALL icmp check (1 of 2): Protocol: ICMP Src ip: 77.223.154.190 Dst ip: 146.90.58.49 Type: Destination Unreachable Code: Protocol Unreacheable
<102> Nov 26 18:02:22 SNTP Synchronised to server: 212.159.6.9
<102> Nov 26 19:02:23 SNTP Synchronised to server: 212.159.6.10
<81> Nov 26 19:02:31 FIREWALL icmp check (1 of 1): Protocol: ICMP Src ip: 192.99.149.33 Dst ip: 146.90.58.49 Type: Destination Unreachable Code: Port Unreacheable
<173> Nov 26 19:27:44 xDSL linestate down
<85> Nov 26 19:27:44 FIREWALL event (1 of 1): created rules
<85> Nov 26 19:27:44 FIREWALL event (1 of 1): modified rules
<173> Nov 26 19:28:01 xDSL linestate down
<173> Nov 26 19:28:31 xDSL linestate down
<132> Nov 26 19:28:33 PPP link down (Internet) [146.90.58.49]
<173> Nov 26 19:28:57 xDSL linestate up (ITU-T G.992.5; downstream: 7648 kbit/s, upstream: 1220 kbit/s; output Power Down: 20.4 dBm, Up: 12.6 dBm; line Attenuation Down: 37.0 dB, Up: 16.8 dB; snr Margin Down: 12.1 dB, Up: 6.3 dB)
<38> Nov 26 19:29:02 PPP CHAP Receive challenge from rhost bras-red9.sf (Internet)
<38> Nov 26 19:29:02 PPP CHAP Receive challenge from rhost PTN-AG01 (Internet)
<38> Nov 26 19:29:02 PPP CHAP Receive success (Internet)
<85> Nov 26 19:29:02 FIREWALL event (1 of 2): deleted rules
<132> Nov 26 19:29:02 PPP link up (Internet) [37.152.210.221]
<85> Nov 26 19:29:02 FIREWALL event (1 of 1): created rules
<85> Nov 26 19:29:02 FIREWALL event (1 of 1): modified rules
<14> Nov 26 19:29:43 CONFIGURATION saved by TR69
<37> Nov 26 19:48:19 LOGIN User admin logged in on [HTTP] (from 192.168.1.64)
<37> Nov 26 19:56:48 LOGOUT User admin logged out on TELNET (192.168.1.64)
<102> Nov 26 20:02:23 SNTP Synchronised again to server: 212.159.6.10
<37> Nov 26 20:42:43 LOGIN User admin logged in on [HTTP] (from 192.168.1.64)
<102> Nov 26 21:02:23 SNTP Synchronised to server: 212.159.13.49
<37> Nov 26 21:06:18 LOGIN User admin logged in on [HTTP] (from 192.168.1.64)
<37> Nov 26 21:17:57 LOGIN User admin logged in on [HTTP] (from 192.168.1.64)
<84> Nov 26 21:46:39 IDS proto parser : tcp null port (1 of 1) : 113.108.21.16 37.152.210.221 40 50 TCP 12203->0 [S.....] seq 2019017420 ack 0 win 8192
<102> Nov 26 22:02:23 SNTP Synchronised to server: 212.159.6.9
<37> Nov 26 22:43:42 LOGIN User admin logged in on [HTTP] (from 192.168.1.64)
<37> Nov 26 22:44:12 LOGIN User admin logged in on TELNET (192.168.1.64)
<102> Nov 26 23:02:01 SNTP Synchronised to server: 212.159.13.49
<102> Nov 27 00:02:01 SNTP Synchronised again to server: 212.159.13.49
<84> Nov 27 00:47:24 IDS proto parser : tcp null port (1 of 1) : 123.151.42.61 37.152.210.221 40 48 TCP 12208->0 [S.....] seq 2090779966 ack 0 win 8192
<102> Nov 27 01:02:01 SNTP Synchronised again to server: 212.159.13.49
<102> Nov 27 02:02:02 SNTP Synchronised to server: 212.159.6.9
<81> Nov 27 02:43:56 FIREWALL icmp check (1 of 1): Protocol: ICMP Src ip: 61.87.1.24 Dst ip: 37.152.210.221 Type: Time Exceeded Code: Time to Live exceeded in Transit
<102> Nov 27 03:02:02 SNTP Synchronised to server: 212.159.6.10
<81> Nov 27 03:24:08 FIREWALL icmp check (1 of 1): Protocol: ICMP Src ip: 125.122.249.222 Dst ip: 37.152.210.221 Type: Destination Unreachable Code: Port Unreacheable
<102> Nov 27 04:02:02 SNTP Synchronised to server: 212.159.13.49
<102> Nov 27 05:02:02 SNTP Synchronised again to server: 212.159.13.49
<81> Nov 27 05:04:55 FIREWALL icmp check (1 of 1): Protocol: ICMP Src ip: 186.54.217.29 Dst ip: 37.152.210.221 Type: Destination Unreachable Code: Port Unreacheable
<81> Nov 27 05:44:50 FIREWALL icmp check (1 of 1): Protocol: ICMP Src ip: 84.90.111.4 Dst ip: 37.152.210.221 Type: Destination Unreachable Code: Port Unreacheable
<102> Nov 27 06:02:02 SNTP Synchronised again to server: 212.159.13.49
<81> Nov 27 06:43:42 FIREWALL icmp check (1 of 1): Protocol: ICMP Src ip: 37.127.2.223 Dst ip: 37.152.210.221 Type: Destination Unreachable Code: Port Unreacheable
<102> Nov 27 07:02:02 SNTP Synchronised to server: 212.159.13.50
<81> Nov 27 07:26:59 FIREWALL icmp check (1 of 1): Protocol: ICMP Src ip: 110.84.239.193 Dst ip: 37.152.210.221 Type: Destination Unreachable Code: Port Unreacheable
<81> Nov 27 07:50:50 FIREWALL icmp check (1 of 1): Protocol: ICMP Src ip: 207.225.85.218 Dst ip: 37.152.210.221 Type: Destination Unreachable Code: Host Unreacheable
<37> Nov 27 07:52:06 LOGIN User admin logged in on [HTTP] (from 192.168.1.64)
<102> Nov 27 08:02:02 SNTP Synchronised to server: 212.159.13.49
<37> Nov 27 08:04:35 LOGIN User admin logged in on [HTTP] (from 192.168.1.64)
<81> Nov 27 08:26:36 FIREWALL icmp check (1 of 1): Protocol: ICMP Src ip: 182.19.61.153 Dst ip: 37.152.210.221 Type: Destination Unreachable Code: Host Unreacheable
Edit: Previously-posted log details edited out at Anotherone's suggestion.
Current router DSL stats:
Uptime: 0 days, 13:11:53
DSL Type: ITU-T G.992.5
Bandwidth (Up/Down) [kbps/kbps]: 1,220 / 7,648
Data Transferred (Sent/Received) [MB/MB]: 48.69 / 724.54
Output Power (Up/Down) [dBm]: 12.6 / 0.0
Line Attenuation (Up/Down) [dB]: 16.8 / 37.0
SN Margin (Up/Down) [dB]: 6.0 / 14.8
System Vendor ID (Local/Remote): TMMB / ----
Chipset Vendor ID (Local/Remote): BDCM / IFTN
Loss of Framing (Local/Remote): 53 / 0
Loss of Signal (Local/Remote): 6 / 0
Loss of Power (Local/Remote): 0 / 0
Loss of Link (Remote): -
Error Seconds (Local/Remote): 23,389 / 0
FEC Errors (Up/Down): 0 / 7,448
CRC Errors (Up/Down): 14 / 1,913,198
HEC Errors (Up/Down): 14 / 352
Re: 'Normal' evening SNRM drop/flat twisted pair RJ11 cable.
27-11-2014 9:00 AM
- Mark as New
- Bookmark
- Subscribe
- Subscribe to RSS Feed
- Highlight
- Report to Moderator
A huge increase in CRC errors, but much smaller increase in Error Seconds, and what looks like an increase of Target SNRM to 15dB.
This suggests that there was a very large burst of noise in a short time frame, it will be interesting to see the graphs.
The line ILQ must be Red for DLM to be behaving in this way. We'll try and get someone from CRT to have a look at this.
Edit: When posting the log, to make things a bit more readable you could snip off the front from the point upto which you'd posted before.
eg. for the current one, it could be posted from here .... <173> Nov 26 08:08:34 xDSL linestate up
Re: 'Normal' evening SNRM drop/flat twisted pair RJ11 cable.
27-11-2014 9:13 AM
- Mark as New
- Bookmark
- Subscribe
- Subscribe to RSS Feed
- Highlight
- Report to Moderator

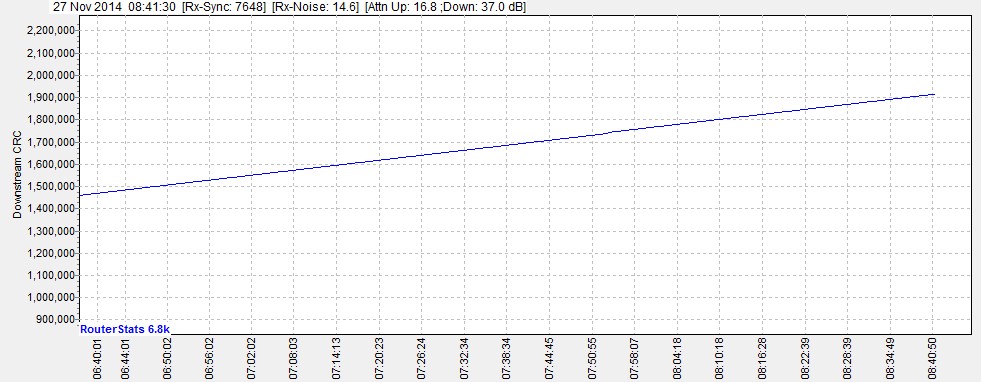
Edit: What amazes me, apart from the numbers themselves, is that the overnight CRC errors increase in a straight line - not exactly coming in bursts is it?
-2014Nov26-1956.jpg)
-2014Nov26-1956.jpg)
-2014Nov26-1956.jpg)
Re: 'Normal' evening SNRM drop/flat twisted pair RJ11 cable.
27-11-2014 10:24 AM
- Mark as New
- Bookmark
- Subscribe
- Subscribe to RSS Feed
- Highlight
- Report to Moderator
Can you start plotting the ES errors as well and post up a graph say in about an hour?
Re: 'Normal' evening SNRM drop/flat twisted pair RJ11 cable.
27-11-2014 10:30 AM
- Mark as New
- Bookmark
- Subscribe
- Subscribe to RSS Feed
- Highlight
- Report to Moderator
Re: 'Normal' evening SNRM drop/flat twisted pair RJ11 cable.
27-11-2014 10:45 AM
- Mark as New
- Bookmark
- Subscribe
- Subscribe to RSS Feed
- Highlight
- Report to Moderator
Quote from: Anotherone Ah, stats from midnight would have helped in the thought process about the errors. Are the CRC errors still increasing at the same rate?
Can you start plotting the ES errors as well and post up a graph say in about an hour?
CRC errors were at 1.9m at 0840, rising in a straight line to 2.3m by 1030, at which point they appear to have suddenly flat-lined, but that was only 15 minutes ago of course. This is very different from yesterday where there were very few CRC's during daylight hours
If I plot the ES errors on the user-defined graph it appears that will replace the graphing of the Rx CRC errors, or am I missing something?
Will try to post the graphs you asked for in your post preceding this one.
Re: 'Normal' evening SNRM drop/flat twisted pair RJ11 cable.
27-11-2014 10:57 AM
- Mark as New
- Bookmark
- Subscribe
- Subscribe to RSS Feed
- Highlight
- Report to Moderator
Quote from: Anotherone Can we see all the combined Rx_SNRM & Sync speed graph(s) for the rest of the night, also the Tx_SNRM as well. There's no need to post the Rx_Sync_Speed graphs as well as it's plotting on the SNRM graph. In fact if you go to the Rx_Sync_Speed graph and right click, you can Untick the Scheduled Capture [Always] to save disk space as a separate saved graph isn't really needed.
Here they are (you will probably notice a gap in the records yesterday evening - am embarrassed to admit I must have switched off the RS recording for a few hours before noticing - no-one else to blame. :-[) :
Edit: can confirm that the Rx CRC errors suddenly stopped at 1030 this morning at 2,319,719 and there hasn't been a single one in the last 30 minutes.
-2014Nov27-0441.jpg)
-2014Nov27-0242.jpg)
-2014Nov27-0043.jpg)
-2014Nov27-0441.jpg)
-2014Nov27-0641.jpg)
-2014Nov27-0043.jpg)
-2014Nov27-0641.jpg)
-2014Nov27-0242.jpg)
Re: 'Normal' evening SNRM drop/flat twisted pair RJ11 cable.
27-11-2014 11:36 AM
- Mark as New
- Bookmark
- Subscribe
- Subscribe to RSS Feed
- Highlight
- Report to Moderator
You have two User-Defined Graphs so in theory you can put CRC's on one and ES on the other. But hold off on that for now, as I said if the CRC's aren't increasing now, may be no point.
Did you save the DSL stats at midnight(ish)? You could also post up the current ones again.
I've got to say that those error figures behaviour is weird.
Don't worry about the gaps, I've done daft things like that myself
Re: 'Normal' evening SNRM drop/flat twisted pair RJ11 cable.
27-11-2014 11:48 AM
- Mark as New
- Bookmark
- Subscribe
- Subscribe to RSS Feed
- Highlight
- Report to Moderator
Also in situations such as this, it can be more useful to set the "change since last sample" option (right click on the graph) when plotting CRC counts. This very clearly exposes pulse episodes.
Note the other (less used) tool in this space - DSLstats - does capture all error counters at the same time... Though both AO and myself have other reservations about the tool.
In another browser tab, login into the Plusnet user portal BEFORE clicking the fault & ticket links
Superusers are not staff, but they do have a direct line of communication into the business in order to raise issues, concerns and feedback from the community.
If this post helped, please click the Thumbs Up and if it fixed your issue, please click the This fixed my problem green button below.
Re: 'Normal' evening SNRM drop/flat twisted pair RJ11 cable.
27-11-2014 11:54 AM
- Mark as New
- Bookmark
- Subscribe
- Subscribe to RSS Feed
- Highlight
- Report to Moderator
Quote from: Anotherone If the CRC errors aren't increasing now, we won't learn anything in the short term from an ES error plot.
You have two User-Defined Graphs so in theory you can put CRC's on one and ES on the other. But hold off on that for now, as I said if the CRC's aren't increasing now, may be no point.
Did you save the DSL stats at midnight(ish)? You could also post up the current ones again.
I've got to say that those error figures behaviour is weird.
Don't worry about the gaps, I've done daft things like that myself
No DSL stats for midnight, only the RS logs.
The RS help pages and one of the setup pages refers to 'plural' user-defined graphs but there is only one tab - I haven't a clue where the second one is hiding!
Current DSL stats:
Uptime: 0 days, 16:20:09
DSL Type: ITU-T G.992.5
Bandwidth (Up/Down) [kbps/kbps]: 1,220 / 7,648
Data Transferred (Sent/Received) [MB/MB]: 53.86 / 749.62
Output Power (Up/Down) [dBm]: 12.6 / 0.0
Line Attenuation (Up/Down) [dB]: 16.8 / 37.0
SN Margin (Up/Down) [dB]: 5.8 / 14.9
System Vendor ID (Local/Remote): TMMB / ----
Chipset Vendor ID (Local/Remote): BDCM / IFTN
Loss of Framing (Local/Remote): 53 / 0
Loss of Signal (Local/Remote): 6 / 0
Loss of Power (Local/Remote): 0 / 0
Loss of Link (Remote): -
Error Seconds (Local/Remote): 31,897 / 0
FEC Errors (Up/Down): 0 / 8,158
CRC Errors (Up/Down): 55 / 2,605,655
HEC Errors (Up/Down): 73 / 352
Agree about the weird behaviour of the error figures - if anyone from CRT is monitoring this would it be possible to ask BTOR whether they are aware of any works which may be affecting those connected to the SHARROW exchange (or possibly those just in my particular area?)
Re: 'Normal' evening SNRM drop/flat twisted pair RJ11 cable.
27-11-2014 12:03 PM
- Mark as New
- Bookmark
- Subscribe
- Subscribe to RSS Feed
- Highlight
- Report to Moderator
In each of the DS and US windows, you can highlight any of the counter labels and right click to select user-def-1 or user-def-2.
If you are using the lite version, you'll need to await input from Anotherone as he is far more familiar with the lite version than am I.
In another browser tab, login into the Plusnet user portal BEFORE clicking the fault & ticket links
Superusers are not staff, but they do have a direct line of communication into the business in order to raise issues, concerns and feedback from the community.
If this post helped, please click the Thumbs Up and if it fixed your issue, please click the This fixed my problem green button below.
- Subscribe to RSS Feed
- Mark Topic as New
- Mark Topic as Read
- Float this Topic for Current User
- Bookmark
- Subscribe
- Printer Friendly Page
- Plusnet Community
- :
- Forum
- :
- Help with my Plusnet services
- :
- Broadband
- :
- 'Normal' evening SNRM drop/flat twisted pair RJ11 ...